Dynasty has a P/E ratio. Here's the rulebook it produces.
I analyzed 1.18 million real dynasty trades and five seasons of production data to answer one question. What does a point of production actually cost? Then I watched what happened to every price a year later. The market gets one thing very right, and one thing very wrong.
BY RYAN KOSIBA · AUGUST 12, 2026 · 15 MIN READ
Every stock has a P/E ratio. Price divided by earnings. It's the first number a value investor looks at, because it separates "this company makes money" from "this price assumes it will."
Dynasty players have the same ratio. It's barely used. Jay Stein's Dynasty Investor series has computed a version of it since 2022 (market value divided by raw points per game), and it deserves credit for planting the flag.
Step 1. Price a point of production
The metric is simple. Take a player's market value (I used crowdsourced consensus market values, the prices your leaguemates actually reference) and divide it by his points per game above a replacement-level starter, roughly the last startable player at his position (QB12, RB28, WR40, TE12). Call it price per point.
The above-replacement part is the sharpening, and it matters. Divide by raw PPG and a barely-startable player looks reasonably priced, because his empty calories count. Surplus over the last startable guy is what you're actually paying for.
Two real players from August 2023 make it click.
- Keenan Allen was valued around 3,400 while producing about 6 PPG above WR replacement. That works out to roughly 570 per point. Every weekly point of surplus production cost 570 in market value.
- Christian Watson was valued around 4,700 while producing about 1.3 PPG above replacement, roughly 3,570 per point. Six times Allen's price for each unit of actual production. The extra was a bet on growth.
Cheap multiples are proven producers the market thinks are dying. Expensive multiples are players whose price is mostly future. Value stocks and growth stocks.
Step 2. Take a price, wait a year, see what happened
Here's the experiment. I went back to August of 2021, 2022, 2023, 2024, and 2025, five separate price snapshots, computed every startable player's price per point on that day, and then just watched. Did the production you paid for actually show up the next season?
One definition before the numbers. A player fails if, the following season, he either played fewer than 6 games or his PPR points per game dropped by 3 or more versus the season that justified his price. Three PPG is a real cliff, roughly a WR1 becoming a WR3, about 50 points across a season. A 15.0 guy posting 13.5 did not fail. Fail means the production you paid for materially didn't show up.
The first result is that the market deserves respect. Across all five snapshots, price per point predicted next-season production change with a correlation of +0.31 (p = 9×10⁻¹⁰), positive in every single year. Cheap points decline and expensive points hold or grow. The cheapest quintile, the discounted veterans, lost an average of 3.0 PPG the following season and failed 57% of the time. The most expensive quintile improved slightly and failed just 23% of the time.
So the veteran discount isn't laziness. On a one-year horizon the market sees the cliff coming and prices it almost perfectly. If you've ever bought a cheap 29-year-old and watched him break your heart by November, you weren't unlucky. You were on schedule.
The board, cell by cell
Split the same data by position and price band and you get the rulebook. The verdict shading is explained below, because (this is the whole point of the article) the verdicts do not follow fail rate alone.
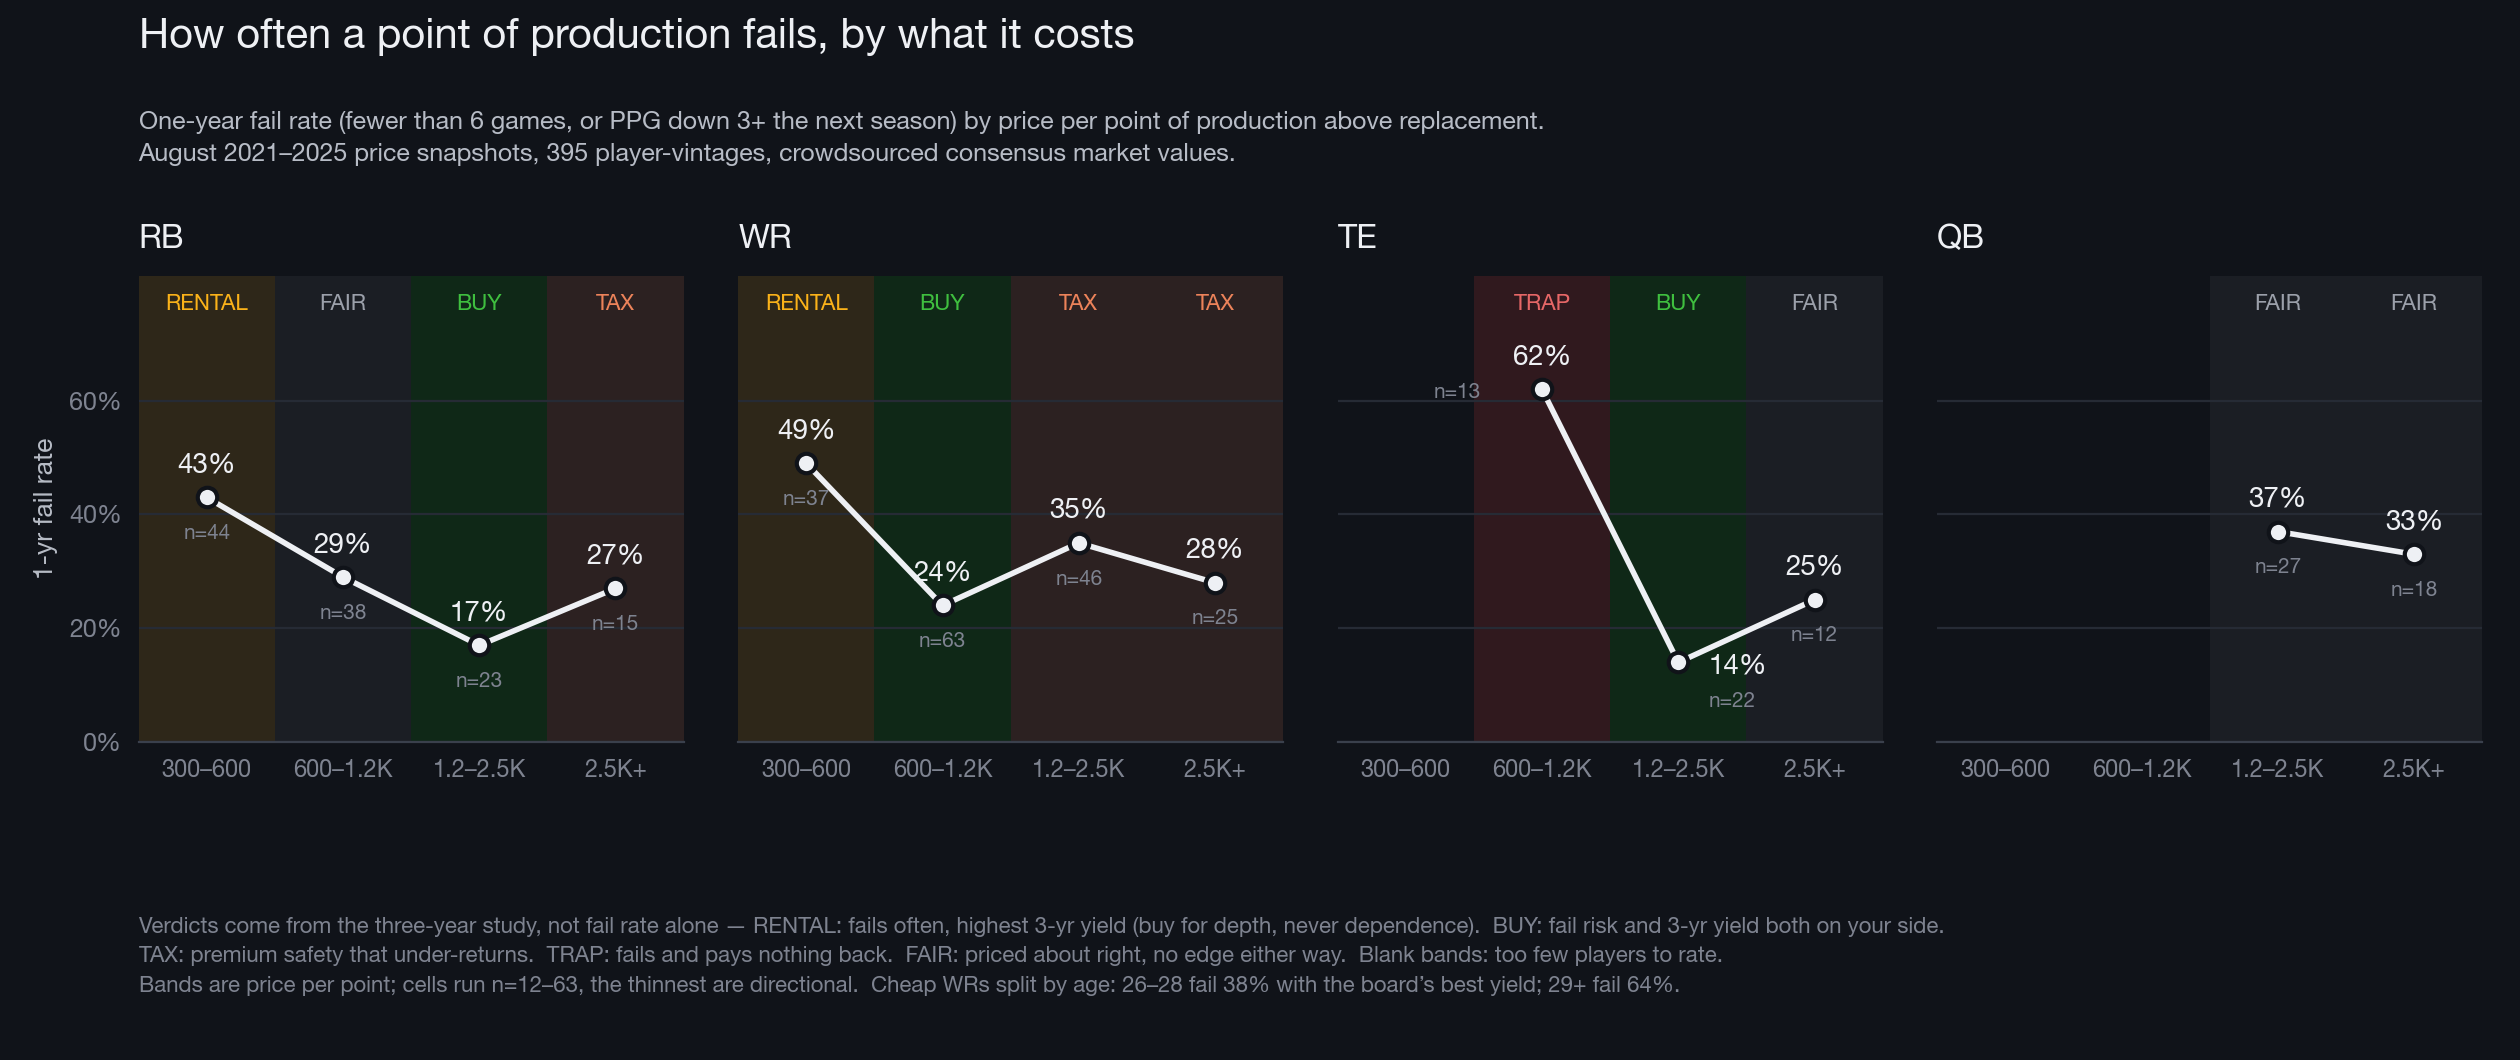
| Pos | Price per point | n | 1-yr fail rate |
|---|---|---|---|
| RB | 300–600 | 44 | 43% |
| RB | 600–1,200 | 38 | 29% |
| RB | 1,200–2,500 | 23 | 17% |
| RB | 2,500+ | 15 | 27% |
| WR | 300–600 | 37 | 49% |
| WR | 600–1,200 | 63 | 24% |
| WR | 1,200–2,500 | 46 | 35% |
| WR | 2,500+ | 25 | 28% |
| TE | 600–1,200 | 13 | 62% |
| TE | 1,200–2,500 | 22 | 14% |
| QB | 1,200–2,500 | 27 | 37% |
| QB | 2,500+ | 18 | 33% |
Add age and the sharpest cells emerge (samples run n=10–44 per cell; the thinnest ones should be read as directional).
- WRs 29 or older priced under 600/pt fail 64% of the time (n=14). The archetypal "value" buy, the aging producer at a discount, is a coin flip you lose twice out of three.
- Mid-priced TEs (600–1,200/pt) fail 62% of the time, the worst cell on the board. TE production priced "reasonably" is almost always a fading vet the market hasn't fully given up on.
- Young premium RBs (under 26, 1,500+/pt) fail just 18% of the time, the safest one-year hold in football.
- WRs at 600–1,200/pt fail 24% of the time, and only 13% ever lose half their value. If this rulebook has one default-buy cell, it's this one.
At this point the market looks smart and the premium looks justified. Expensive points are safe points. Then you extend the window.
Step 3. Wait three years instead
Fail rate and long-run return turn out to be different axes. Here's what the 2021–2023 vintages returned over their following three seasons, by purchase-price quintile.
| Price at purchase | 3-yr points | Pts per 1,000 | Value kept |
|---|---|---|---|
| Cheapest quintile | 617 | 174 | 85% |
| Q2 | 582 | 136 | 77% |
| Q3 | 562 | 116 | 74% |
| Q4 | 589 | 119 | 77% |
| Most expensive quintile | 479 | 108 | 67% |
The discounted veterans returned 1.6x the points per dollar of the premium bin, negative and significant in each vintage separately (−0.33, −0.25, −0.31). They scored more total points in raw volume, 617 to 479. And the resale column is the one that should change how you trade. The discount bin held 85% of its value over three years while the premium bin, bought specifically because youth "holds value," kept 67%.
Now run that lens back over the cells.
- The 64%-fail old-WR cell still returns 135 points per 1,000 over three years. That's more than young expensive WRs, who fail less often (29%) but yield only 90 per 1,000, the worst three-year return in the WR matrix.
- The safe young premium RBs yield 110 per 1,000. Cheap young RBs fail 36% of the time and yield 157.
- The best cell on the entire board is WRs aged 26–28 under 600/pt, at 172 points per 1,000 (n=13, directional, but it's the discount-producer archetype again).
Every step up the price ladder cuts your one-year fail risk and cuts your three-year yield at the same time. Cheap points are rentals that fail loudly. Expensive points are insurance you overpay for. The market never sells you both.
Put it in market terms. Expensive youth is a growth stock trading at an inflated multiple, and what the markup buys you is a margin of safety, the feeling that a young player can't crater the way a 30 year old can. The one-year fail rates even agree. Stretch the window to three years and that safety never pays for itself. You fail less and you return less, which is the exact trade an overpriced growth stock makes. You pay up front for certainty and collect someone else's downside.
I call the gap the youth tax. Dynasty managers pay a premium for time, and in five years of measurable data the premium has never cashed. The idea itself isn't new. Adam Harstad has argued for years, on theory, that the dynasty market over-discounts aging players. What's been missing is the priced receipt, and that's what the vintage tables are. The first multi-year test of the youth premium against what the market was actually charging at the time.
One more corroborating receipt. An early version of my trade-implied pricing engine, values solved purely from ~149,000 real trade executions with no polls involved, prices the veteran discount even steeper than consensus does. If anything, these tables understate the effect.
So the four asset classes, one verdict per cell. This is the shading in the chart above.
- RENTAL Cheap, old, high fail rate, highest yield. Discount veteran WRs, cheap RBs. They break down often and out-return everything anyway, because you paid for a cliff and got a slope.
- BUY The 600–1,200/pt WR band and young mid-priced WRs. Modest fail rates, solid yield, and the best value retention on the board.
- TAX Young expensive WRs and premium-priced "upside." The lowest returns in the study, purchased for a safety margin smaller than advertised.
- TRAP The mid-priced TE cell. 62% fail, nothing on the back end. Never.
What to actually do
- Contenders should buy discounted production, but not the deepest discount. The market's steepest markdowns (WRs 29+ under 600/pt) fail 64% of the time. They're cheap because the market is usually right about them specifically. The contender cells are one notch up. WRs aged 26–28 under 600/pt (38% fail, the best yield on the board) and older WRs the market still respects at 600–1,500/pt (25% fail, thin sample). Treat any high-fail cell as depth you buy two of, never the piece a playoff run depends on.
- Rebuilders should live in the WR 600–1,200 band. Best combination of fail rate, three-year yield, and value retention in the study.
- Pay the premium only at the very top. One purchase in the August 2023 premium bin worked. D.J. Moore, 696 points. The 2021 vintage's CeeDee Lamb, bought at a nosebleed price, returned 938 points and gained value. The exception has a shape. True elite young cornerstones, top-three-at-position conviction. If you're not sure a player is that, he isn't, and you're in the tax bin. Christian Watson at 4,700 returned 339 points (72 per 1,000). Cam Akers, 147. AJ Dillon, 127.
- Never buy the mid-priced TE. The board's one unconditional rule.
Who fits the buy cells right now
Here's today's board (values as of August 12, 2026) run through the same construction. Latest consensus value divided by 2025 production above replacement, same PAR floor, same bands. Rookies and players without a startable 2025 season don't price out, so they're absent by design; injury-shortened seasons are marked.
BUY WR 600–1,200/pt · the default-buy band
| Player | Age | 2025 PPG | Per pt |
|---|---|---|---|
| Puka Nacua | 25 | 23.4 | 715 |
| Rashee Rice* | 26 | 18.8 | 728 |
| Amon-Ra St. Brown | 26 | 20.2 | 860 |
| Davante Adams | 33 | 15.9 | 882 |
| Jaxon Smith-Njigba | 24 | 21.2 | 913 |
| George Pickens | 25 | 17.2 | 1,067 |
| Chris Olave | 26 | 16.8 | 1,081 |
| Garrett Wilson* | 26 | 16.6 | 1,093 |
| Ja'Marr Chase | 26 | 19.6 | 1,161 |
Read that list again. The best young WRs in football are currently priced in the study's default-buy band. Puka Nacua at 715 per point is elite production at a value-stock multiple, and Chase at 1,161 is cheaper per point of surplus than most mid RBs. When production is this enormous, even a nosebleed sticker price can be a fair multiple. The band's history is 24% fail with the best value retention on the board.
BUY RB 1,200–2,500/pt · the safest RB band
| Player | Age | 2025 PPG | Per pt |
|---|---|---|---|
| Kyren Williams | 26 | 15.5 | 1,353 |
| Travis Etienne | 27 | 14.9 | 1,362 |
| Javonte Williams | 26 | 15.2 | 1,387 |
| D'Andre Swift | 27 | 14.3 | 1,550 |
| Saquon Barkley | 29 | 14.5 | 1,802 |
| Jaylen Warren | 27 | 13.6 | 1,802 |
| Omarion Hampton* | 23 | 15.1 | 1,968 |
| Bucky Irving* | 24 | 13.8 | 2,093 |
| Ashton Jeanty | 22 | 14.4 | 2,492 |
The young end of this band (Jeanty, Hampton, Irving, all under 26) sits in the 18%-fail subcell, the safest one-year hold in football. The veteran end (Etienne, Swift, Warren) is the same band the 2021–2023 vintages paid 110–123 points per 1,000 for. Fine holds, not steals.
BUY TE 1,200–2,500/pt · 14% fail
| Player | Age | 2025 PPG | Per pt |
|---|---|---|---|
| Tucker Kraft* | 25 | 14.6 | 1,572 |
| Brock Bowers* | 23 | 14.7 | 2,330 |
Two things worth saying about today's board beyond the buys. First, the deep-discount rental cells are empty. No WR aged 26–28 prices under 600/pt right now, and no young RB does either. The Keenan Allen of August 2023 doesn't exist in August 2026. The closest thing is the contender-vet cell, where Davante Adams (882/pt) sits alone. Either the market has tightened, or this year's discounts fell below the study's value floor. Second, the TE trap band (600–1,200/pt) currently holds George Kittle at 810/pt (at 32, the exact fading-vet archetype the 62% fail rate is made of) and, as a technicality, Trey McBride at 1,005/pt. McBride lands there for the opposite reason (a 26-year-old producing so much that TE points look cheap on him), which is a reminder that band verdicts are history, not scouting reports.
* 2025 season shortened by injury (6–12 games); PPG is per game played, which the study prices at face value.
The honest fine print
Every study like this deserves its caveats in plain view. Cell sizes run n=10–63; I've flagged the thin ones as directional, and the ordering of cells is stable when I tighten the fail threshold, which is what makes the rules robust. A player barely above replacement has a tiny denominator that inflates his multiple (a big-name WR coming off an injury-wrecked 2025 prices out near 20,000 per point on today's board, not because the market is insane but because his denominator collapsed), so the study floors the production denominator at 0.3 PPG and drives rules off bands, not raw ratios. The multi-year study covers players trackable in current ID mappings, so some fully retired veterans drop out of early vintages; that flatters the cheap bin somewhat, but a 1.6x gap is too wide for it to explain away. Values are crowdsourced consensus 1QB market prices; replacement levels are QB12/RB28/WR40/TE12; production is PPR. And three years is my window because that's how much clean data exists. A longer horizon may yet vindicate someone's 2019 first-round pick, though he will be vindicated alone.
Why I did this
I built My Dynasty Ledger on a simple idea. Your dynasty roster is a portfolio, and you should manage it with real prices, your league's own market, priced from real trades, not polls or gurus. This study is the same idea taken seriously. A market this good at one-year forecasts doesn't get beaten by feel. Your edge is price discipline. Knowing what a point of production costs, which cells of the board you're standing in, and refusing to pay the tax on hope.
The old guys are cheap for a reason. They're just not as cheap as the reason says.
DATA: 1,184,628 TRADES ACROSS 64,969 SLEEPER DYNASTY LEAGUES (JAN 2024–AUG 2026); CROWDSOURCED CONSENSUS MARKET VALUES AND PPR PRODUCTION, AUGUST 2021–2025 VINTAGES; 395 PLAYER-VINTAGES IN THE RULEBOOK MATRIX; CURRENT-BOARD CELLS PRICED AUGUST 12, 2026. ANALYSIS CODE AND METHODOLOGY AVAILABLE ON REQUEST.